
I’ll be hosting a webinar today (or by the time you read this it will be done) discussing Earnings360. I’ll get you more info on how to participate in this quarterly service later in the week. Today…
I just want to quickly point out a couple of key items I’m observing in the market.
Today’s sharp move higher has been beneficial for Options360’s position in the Invesco QQQ Trust, otherwise known by its ticker, QQQ.
If you recall, we had established a combo of both bull and bear trades 10 days ago. We closed out the bear side last Thursday for a 43% profit and today, we were able to roll the call side to bring the cost basis down to just $0.90. It is now locked in profit.
That said, this whiplash action is not healthy. The way we’re seeing markets move suggests a dire lack of liquidity and a lot of options-driven, and therefore leveraged, market participation. These wild swings in the market also suggest imbalance, and with the moves we’ve seen just through the past week, things look to be pretty out of balance right now.
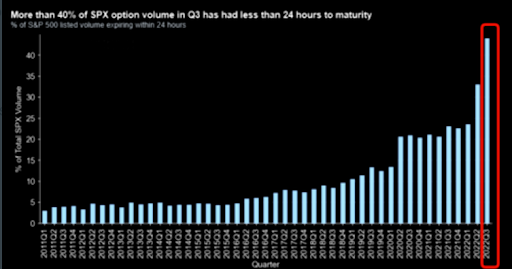
I bring up these three charts to show how options trading continues to be the tail that wags the dog and how people are getting increasingly short in the near-term, and perhaps becoming a little bit wrong footed in their approach. Let’s take a look at what the charts could be telling us.
Join Options360 for just and start your one-month trial today!
The use of weekly (and even daily) options is getting out of control. This graph shows options for SPX, which does indeed have daily options. The trend holds true for the popular ETFs such as SPY and QQQ which have Monday, Wednesday and Friday expirations and, of course, individual stocks come with weekly expirations.
Secondly, There has been an… let’s just say…
Continue reading at WEALTHPOP.com
