
It was a close call this May with a doom-saying title “Crypto Apocalypse?” where I shared with you an annihilating model for Ethereum and a bearish chart of Bitcoin. Let’s see what…
happened in the crypto market since then in the chart below.
Start Your Free Options Boot Camp with Trader Travis
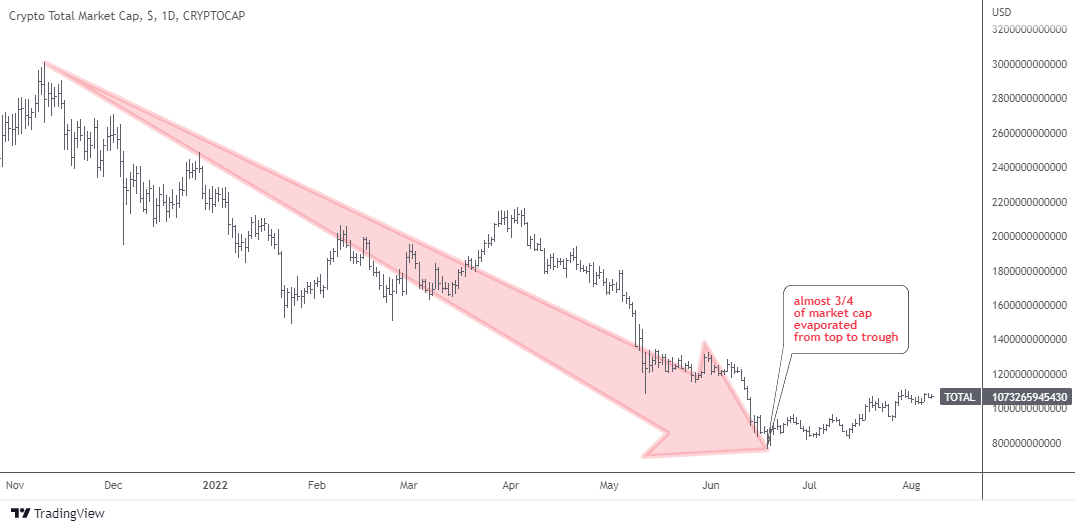
More than $2 trillion of wealth was destroyed during that collapse. Some people were calling it a “crypto-winter” of the market. All of us have probably noticed that less videos and posts with clickbait titles on “how to become a crypto-millionaire” or new rising stars in the crypto-market have been popping up on social media lately.
In the next market share chart, let’s check the status quo of the market leaders.
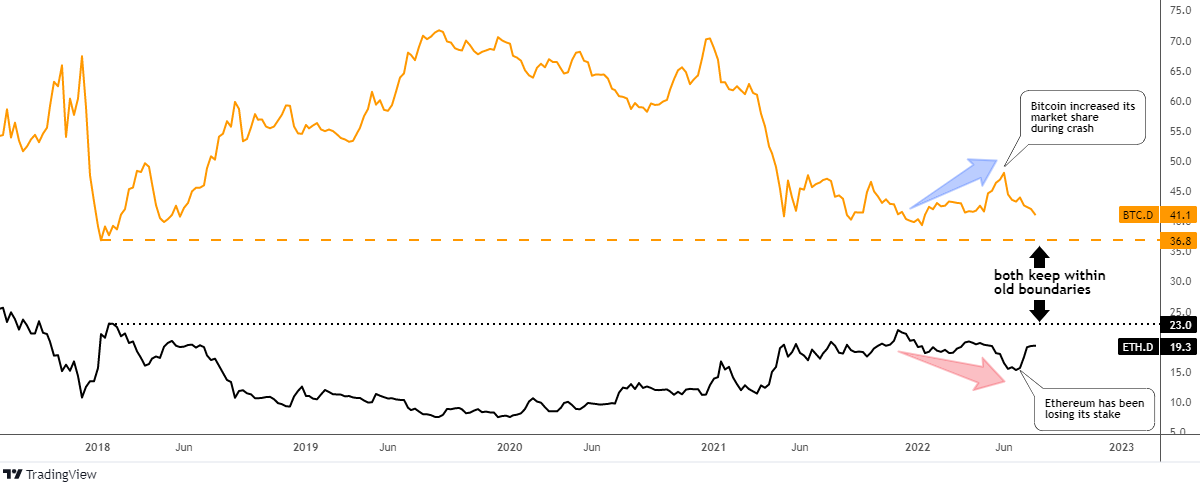
Bitcoin was falling slower than the rest of the market as some coins, even in top 20 tier, were busted very rapidly. Just look at the second largest coin Ethereum, it was losing its market share badly from 22% down to 15%, a level unseen since last January.
These days, both top coins are moving back to its historic boundaries. So, the status quo of the market remains unchanged. Bitcoin has a small surplus and Ethereum is leaking wounds as it is still in the red. However, the latter could take this chance to bounce off the valley to break up this long standing equilibrium.
Watch the Ethereum merge set for September 19th when the Ethereum completes its…
Continue reading at INO.com
