
Back in June, I shared with you an alternative scenario for gold with a downside trigger on the trendline support. Looking at the chart below…
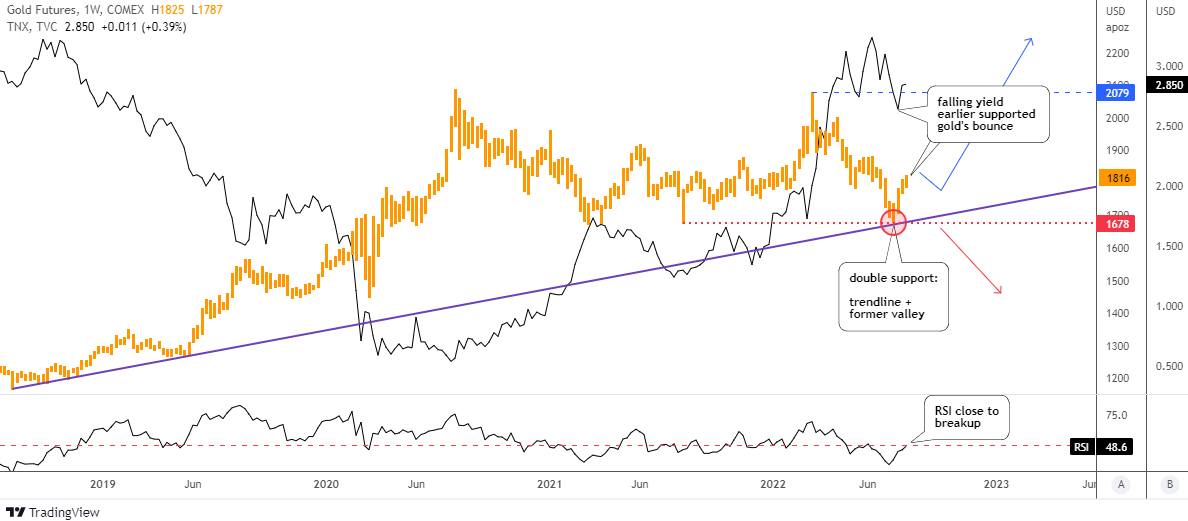
I highlighted it with a purple color in the weekly gold futures chart below. This area is fortified with the red horizontal trendline based on the former valley of $1,678. Though, it’s a double support level.
The easing inflation data limits the hawkish expectations on the Fed rate hikes. Though, the 10Y’s advance has been paused as the market took some gains amid uncertainty.
Start Your Free Options Boot Camp with Trader Travis
However, the real interest rate is still strongly negative at -6%. The labor market shows vitality according to statistics. This leaves the room for the Fed to keep tightening until something breaks down.
The 10Y bounced off recently from 2.6% to 2.85% and nobody knows if it’s a continuation or a consolidation.
The gold market has been trapped with the whole uncertainty as it has built a large sideways consolidation since August 2020.
As long as the gold futures price keeps both above the former valley of $1,678 and the trendline support there is a chance to see the retest of the all-time high of $2,089.
For a bullish setup, the price should chart the minor correction that should…
Continue reading at INO.com
