
Gold prices traditionally move inversely to the dollar. But when they move higher together, it could mean a breakout to the upside is coming. And that’s exactly what we’re seeing right now…
We are already halfway through February, and gold prices are still in the midst of a consolidation phase.

The most interesting thing about it is how mild it has been, at least so far.
Since crossing above $1,320 in late January, gold prices have traded in a pretty narrow range, closing between $1,307 and $1,324.
Even more impressive is how the price of gold has held up in that range, clearly above $1,300, in the face of a stronger U.S. dollar.
The U.S. Dollar Index (DXY) has actually rallied since the end of January, gaining as much as 150 basis points.
Normally a stronger dollar is bad for gold. But that’s not always the case. There have been periods when both rose simultaneously.
And what happened to gold afterwards will impress you.
I’ll show you exactly what that means for gold prices after we recap last week’s gold price action…
The Price of Gold Moved Laterally Last Week
It was a relatively uneventful start to the week in gold as the price began last Monday (Feb. 11) at a low of $1,305. This was just as the DXY was beginning a new climb, having reached 96.8 at 8 a.m.
7-Day Cash Course: With the secrets in this video series, you could potentially start collecting anywhere from $1,190, $1,313, and even $2,830 in consistent income – each and every week. And it can be yours for only $1…
The dollar rallied, pulling its index up to 97.10 by 2 p.m., and surprisingly, gold bounced back to $1,309 by mid-afternoon.
The dollar backed off on Tuesday (Feb. 12), retreating from an early-morning peak at 97.17, then dropping back to 96.7 by early afternoon. That was enough to give gold reprieve, allowing it to rally back to a close at $1,311.
But the dollar index soared back on Wednesday (Feb. 13), well above 97, peaking at 97.25 just after 5:30 p.m. Gold took it on the chin, bottoming at $1,306 at 3 p.m.
Here’s the DXY in the rearview mirror for the past week:
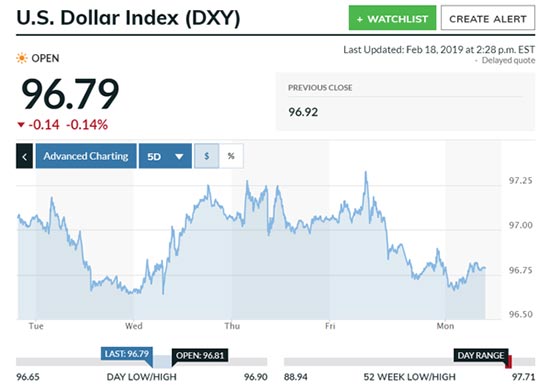
Just before markets opened on Thursday (Feb. 14), it seemed gold wouldn’t get any loving on Valentine’s Day. Gold bottomed at 7 a.m. at $1,304. But lots of bargain hunters stepped in, bidding the metal back up to $1,311 at 8 a.m., finally closing at $1,313. Meanwhile, the DXY bounced between 97 and 97.25, finally ending the day at 97.
Then on Friday (Feb. 15), even as the DXY remained strong above 97, gold roared back, opening at $1,318. The dollar index sold down to 96.9 by the close, helping gold climb further to reach back above $1,320, closing at $1,321.
And on Monday (Feb. 18), with stock markets closed for Presidents Day, gold performed well. The DXY hovered around 96.8, but gold had begun climbing the previous evening, and it ended the shorter trading day at $1,326.
While I expect to see a bit more of this consolidation, gold prices moving alongside the DXY has historically been very good for the metal.
Here’s why that could help gold reach my latest target price…
We’re On Track for My Latest 2019 Gold Price Target
The DXY has certainly managed a decent comeback from its recent lows near 95. It has “tested” 97, but so far, that seems to remain as overhead resistance.
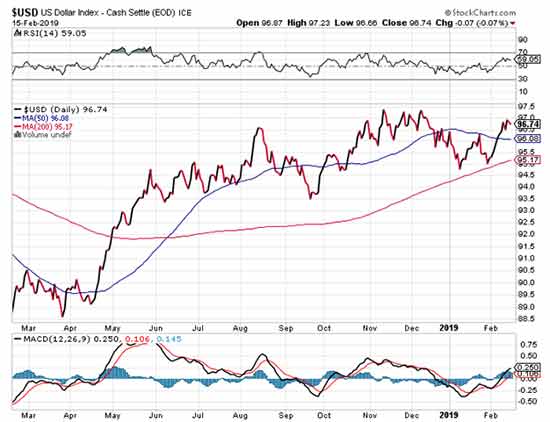
Looking at the relative strength index and moving average convergence divergence, momentum seems to be on the dollar’s side. And with the DXY back above 96 (the 50-day moving average), it does appear to have strength.
The recent closes at or below 97 do, however, highlight a lower high than what the DXY was able to manage in November and December. For now, it appears to me that the jury is out and we need to give the DXY more time to tell us where it’s headed next.
The encouraging aspect of this is how well gold has held up.
So far, at least, gold’s correction has been negligible. In fact, it would seem more appropriate to call it a consolidation, especially against the backdrop of a stronger dollar.
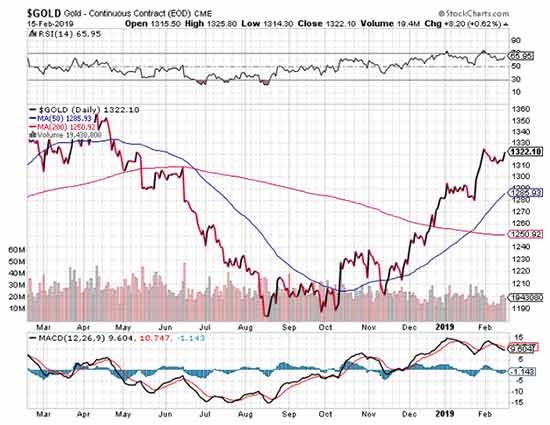
After gold’s January rally that took it from $1,280 to $1,324, gold has stayed in a range between $1,304 and $1,324. Impressively, until now, $1,300 has remained as the new support level.
Barring any black swans, I’d expect to see gold continue to move in this range a little longer, perhaps another week or two, until it starts to move higher once more.
I think the “golden staircase” pattern I noted last week will continue to play out, potentially pulling gold to $1,340 next, followed by $1,360.
Like I said above, gold doesn’t have to hurt just because the dollar is strong. Yes, that’s often how things play out. But when gold rises at the same time as the dollar, to me it’s a sign of even more strength.
In the chart below, I’ve highlighted extended periods when the dollar rose. As you can see, they certainly didn’t seem to be impediments to gold’s advance. Between April 2005 and April 2006, gold surged by 58%.
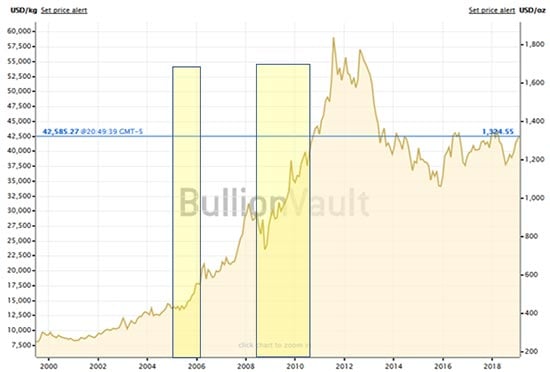
And between spring 2008 and midyear 2010, the dollar rallied 25%. In that time, gold ran up by 32%.
But note that the period following those yellow bars, when the dollar declined significantly, gold continued to power much higher.
For all we know, we could be at the start of one of those times when both the dollar and gold move higher together. If so, that’s great. But remember, once the dollar goes back into bear mode, gold could see a huge move up for months or years.
Consider too the rising tide of central banks buying gold that I pointed out last week. Now we’ve got news that China has bought nearly 10 metric tons of gold in December, plus an additional almost 12 metric tons in January. And according to Commerzbank, “In the past, the PBOC has tended to buy gold for several months in succession.”
Here’s a look at my recent recommendations:
The DB Gold Double Long Exchange Traded Notes (NYSEArca: DGP) are down about 7.8%, but it’s only been a little over one month. Gold’s bull is looking strong, so stay long DGP and/or buy on dips.
The VanEck Vectors Junior Gold Miners ETF (NYSEArca: GDXJ) has participated nicely in the rise of gold stocks and is now up about 7.4% since mid-January. Continue to buy on dips.
To sum up, gold’s been consolidating for two weeks. But the downside has been very limited so far. Gold seems to be signalling good strength in the face of a strong-ish dollar.
Conditions look very favorable for the new bull to continue. Let’s wait and see what gold does once this consolidation phase runs its course.
People Pay $30,000 for These Secrets – for You, It’s Just $1
The stream of secrets and techniques you’ll gain in this seven-day boot camp could set you up for life. America’s No. 1 Pattern Trader Cash Course is designed to teach you all of the ins and outs of profitable trading so you can make thousands in extra income – year in and year out. Best of all, it can be yours for only $1…
Follow Money Morning on Facebook, Twitter, and LinkedIn.
About Money Morning: Money Morning gives you access to a team of ten market experts with more than 250 years of combined investing experience – for free. Our experts – who have appeared on FOXBusiness, CNBC, NPR, and BloombergTV – deliver daily investing tips and stock picks, provide analysis with actions to take, and answer your biggest market questions. Our goal is to help our millions of e-newsletter subscribers and Moneymorning.com visitors become smarter, more confident investors.To get full access to all Money Morning content, click here.
Disclaimer: © 2019 Money Morning and Money Map Press. All Rights Reserved. Protected by copyright of the United States and international treaties. Any reproduction, copying, or redistribution (electronic or otherwise, including the world wide web), of content from this webpage, in whole or in part, is strictly prohibited without the express written permission of Money Morning. 16 W. Madison St. Baltimore, MD, 21201.
