
Back in September, I shared with you my take on the USDJPY currency pair based on 360° view. A combination of fundamental factors and technical factors has supported the continued strength of the U.S. dollar relative to the Japanese yen. However…
the majority of readers predicted the opposite, as you can see in the screenshot below.
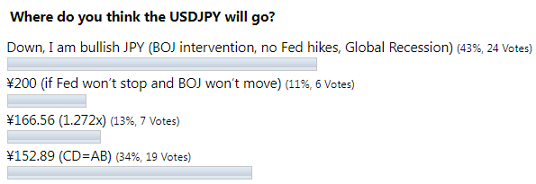
As the second largest vote played out the best, the USDJPY has soared more than six percent to reach a peak of ¥151.94. The previous time this level appeared on this chart was in the summer of distant 1990, two decades ago. That move was close to hit the CD=AB target at ¥152.89, however it has lost the momentum.
The pair has lost more than it gained in that call and there is a question, is that all or are we just in a large correction?
I prepared for you another bunch of visualizations below to answer that question.
Let’s start with the fundamentals first in the interest rate comparison below.
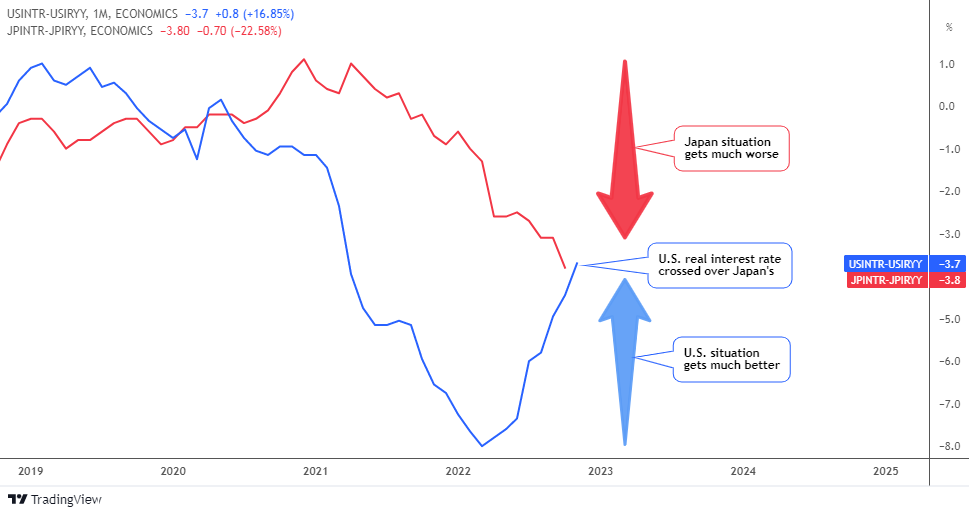
The Federal Reserve is actively trying to control inflation by raising interest rates at each and every meeting. As a result, the real interest rate in the U.S. has soared from negative minus 8 percent this spring up to the current level of minus 3.7 percent.
It contrasts with the “let it be” approach of the Bank of Japan. Hence, the Japanese real interest rate has been sinking lower and lower to finally cross the U.S. real interest rate as shown in the chart above.
The margin is only 0.1 percent and it could probably rise by 0.5 percent this week at the Fed meeting. This makes U.S. assets more attractive, which will boost dollar demand.
The next chart shows the current market distortion that is clear as day…
Continue reading at INO.com
