
Please take a look at the graph below. These futures left their competitors far behind with a tremendous gain of almost twenty percent in only one month…
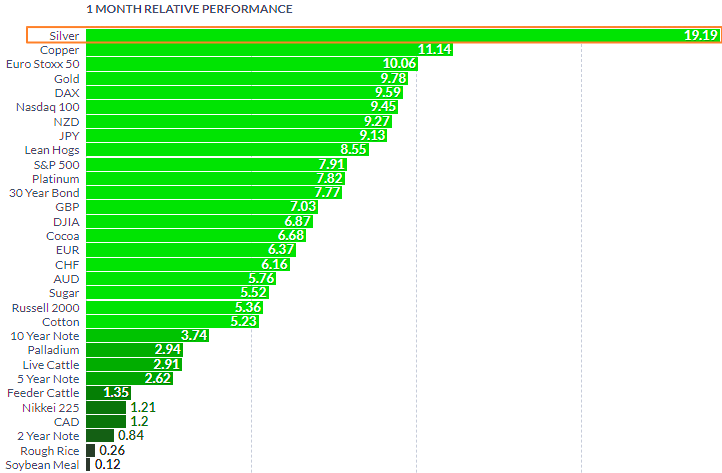
On a one-month horizon, silver’s meteoric price increase is undeniable. None of the metals can even come close. Copper is lagging eight percent behind as gold futures show only half the performance of silver. By the way, I am about to show you the relative dynamics of these top metals in the chart below.
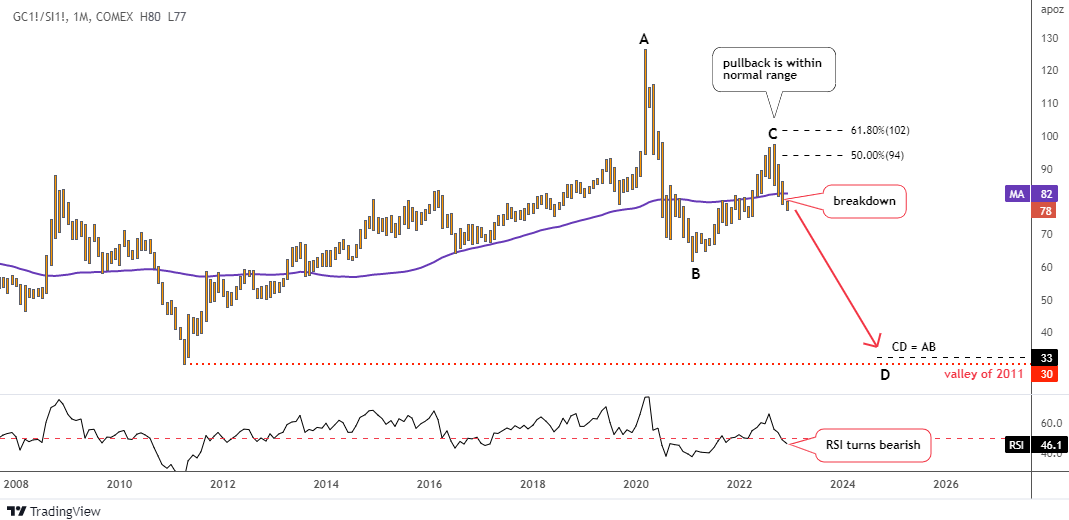
The chart above visualizes the comparative superiority of silver futures over gold futures that we revealed in the first graph. The white metal has been reversing its nine-year losses since the bottom of 2011 at 30 oz up to the all-time high at 127 oz in 2020, where the large age long cycle has been completed.
I wrote about it more than two years ago in the post titled “Diamond” Pattern Pushed Gold To Sky Vs. Silver. That piece has attracted a lot of attention as it was shared more than two hundred times with a bunch of your valuable comments.
From the record-high price in 2020 to 2021, the ratio has been…
Continue reading at INO.com
