
After a harrowing week for gold, gold prices still sit right at the edge of correction territory.
Strong tech stock earnings early in the week were then followed by positive U.S.–EU tariff news and strong economic numbers.
All of this pushed and pulled on the dollar, which moved the price of gold right alongside it.

That kept the metal in a range between $1,218 and $1,233 as the bulls and bears fought it out.
There are several reasons the dollar may be done rising for awhile, and that should help gold.
But a contrarian signal from the futures market may be even more telling – and could cause gold to explode higher in the weeks and months ahead.
Let’s look at recent gold price action and then delve into this a bit further…
Why Last Week Could Be a Turning Point for Gold Prices
Gold started out on a high note last week, opening on Monday (July 23) at $1,231, then falling until early Tuesday (July 24) morning as the U.S. Dollar Index (DXY) peaked at 94.8.
Gold followed riskier assets a bit higher on Tuesday, with stocks popping after good earnings from Alphabet Inc. (Nasdaq: GOOGL), while the dollar index backed down to 94.45 before closing near 94.60.
Powerful Investment Income Stream: The Treasury is sitting on an $11.1 billion money pool. By adding your name to a special distribution list, you could begin collecting $1,795 or more every month. Get the details…
On Wednesday (July 25), news emerged that the European Union was preparing $20 billion in tariffs, denting the dollar and sending the DXY to 94.2 by the close.
But stocks also rallied on the announcement that the United States and EU would work together toward zero tariffs. This helped gold rally back by $8 and close at $1,232.
Here’s the DXY action of the past week…
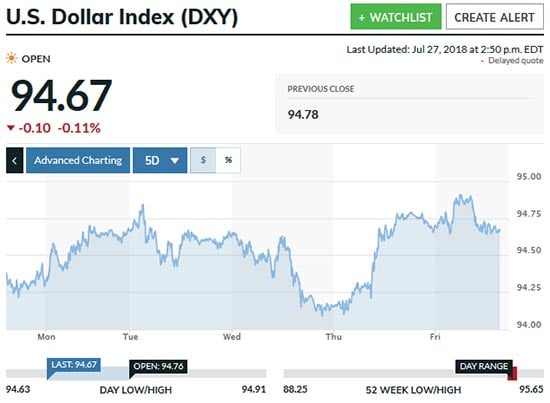
Those gold gains evaporated on Thursday (July 26) as the markets shot higher on looser risk appetites.
Early on Friday (July 27) morning before strong GDP growth numbers came in at a healthy 4.1%, gold dipped to $1,218.
But consensus was slightly higher at 4.2%, so the dollar index retreated to 94.65, allowing gold to return to the $1,223 level.
I think this might finally be the end of the DXY’s pull on gold prices, and the indicator I’m following is making my latest gold price forecast especially bullish…
What This Indicator Means for My Gold Price Prediction
Despite the strong Q2 U.S. GDP numbers, expectations of considerably higher levels actually drove buyers to bid the greenback higher. We can see that action at work on Thursday afternoon.
But a sobering comment from CIBC World Markets’ senior economist Avery Shenfeld should not be ignored. He said, “Growth flowered in the spring, but there were plenty of reasons to think that the U.S. economy can’t sustain anywhere near that pace head… Overall, these are definitely big numbers, but not unexpectedly so, and should not alter views on the Fed or the second half outlook much.”
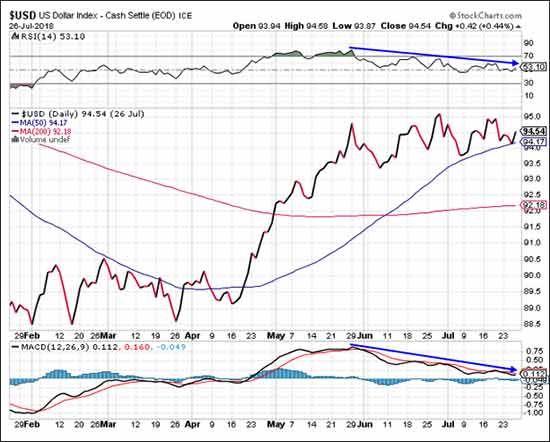
In other words, the dollar may have finally peaked and be ready to trend lower.
We know from the relative strength index (RSI) and moving average convergence divergence (MACD) that momentum has been waning for the past two months, and this as the DXY has pushed up against overhead resistance at 95.5. Take a look…
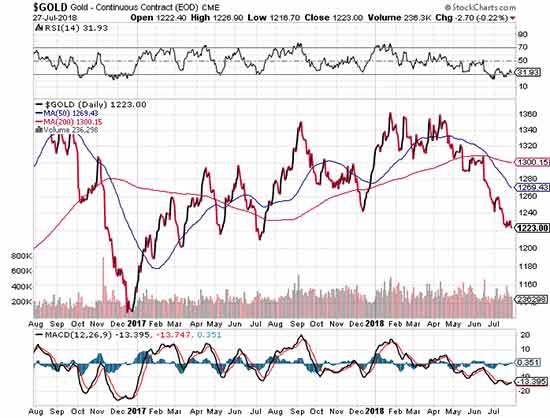
Looking at gold from the perspective of the last two years is disheartening for bulls.
We’ve seen it fall back from $1,360 to $1,220 and currently hold near that level. The action in the RSI and MACD momentum indicators are encouraging. Both are low and appear to be exhibiting bottoming action.
I’ve put that in a chart for you here…
But the futures market has some encouraging news.
Shorting by gold futures speculators has just reached near-record levels. That helps explain gold’s three-month cascade.
But it’s also a great contrarian signal since those shorts will need to be covered by buying.
This suggests gold may have seen its bottom and could explode higher from here. If that happens, look for $1,270 in short order, perhaps followed by a top of $1,300 by late this summer.
As for gold stocks, the VanEck Vectors Gold Miners ETF (NYSE Arca: GDX) has retreated along with gold, especially since early July.
We can also see that it has been testing its previous low of $21.25 touched back in December and again in March. I’ve marked the previous lows in the chart below…
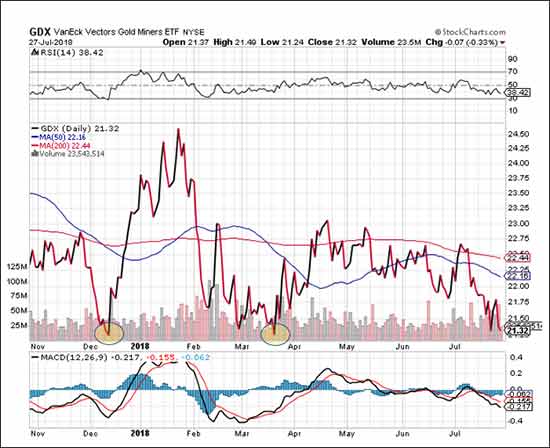
If GDX can establish a higher low and then turn higher along with gold, look for GDX to retake the $22.25 level, then perhaps $23 on a second leg higher.
So while all the technical and sentiment indicators are pointing to a possible bottom in gold and gold stocks, some interesting fundamental news is worth considering, too.
This week, the China Gold Association reported that in Q1, China produced just 190.28 metric tons of gold, or 7.9% less than the first half of 2017. And this comes on the heels of a 6% annual decline last year over 2016.
The government’s more stringent environmental rules are being blamed. And yet China’s output is worth watching closely, as that nation just happens to be the world’s top gold producer at 440 metric tons in 2017, with Australia a distant second at 300 metric tons.
As demand continues strong, especially from Asia, the Middle East, and Europe, weakening supply is likely to help bolster higher prices.
Public Law 92-313 Creates $11.1 Billion Cash Bonanza
Thanks to an obscure law, over 100 government agencies are required to pay rent, including the DOJ, FBI, and NASA.
This money is being funneled into the Treasury. And it’s helped create an enormous $11.1 billion pool of money.
If you add your name to a special distribution list, you could begin collecting $1,795 or more every month from this powerful investment income stream.
Follow Money Morning on Facebook, Twitter, and LinkedIn.
About Money Morning: Money Morning gives you access to a team of ten market experts with more than 250 years of combined investing experience – for free. Our experts – who have appeared on FOXBusiness, CNBC, NPR, and BloombergTV – deliver daily investing tips and stock picks, provide analysis with actions to take, and answer your biggest market questions. Our goal is to help our millions of e-newsletter subscribers and Moneymorning.com visitors become smarter, more confident investors.To get full access to all Money Morning content, click here.
Disclaimer: © 2018 Money Morning and Money Map Press. All Rights Reserved. Protected by copyright of the United States and international treaties. Any reproduction, copying, or redistribution (electronic or otherwise, including the world wide web), of content from this webpage, in whole or in part, is strictly prohibited without the express written permission of Money Morning. 16 W. Madison St. Baltimore, MD, 21201.
